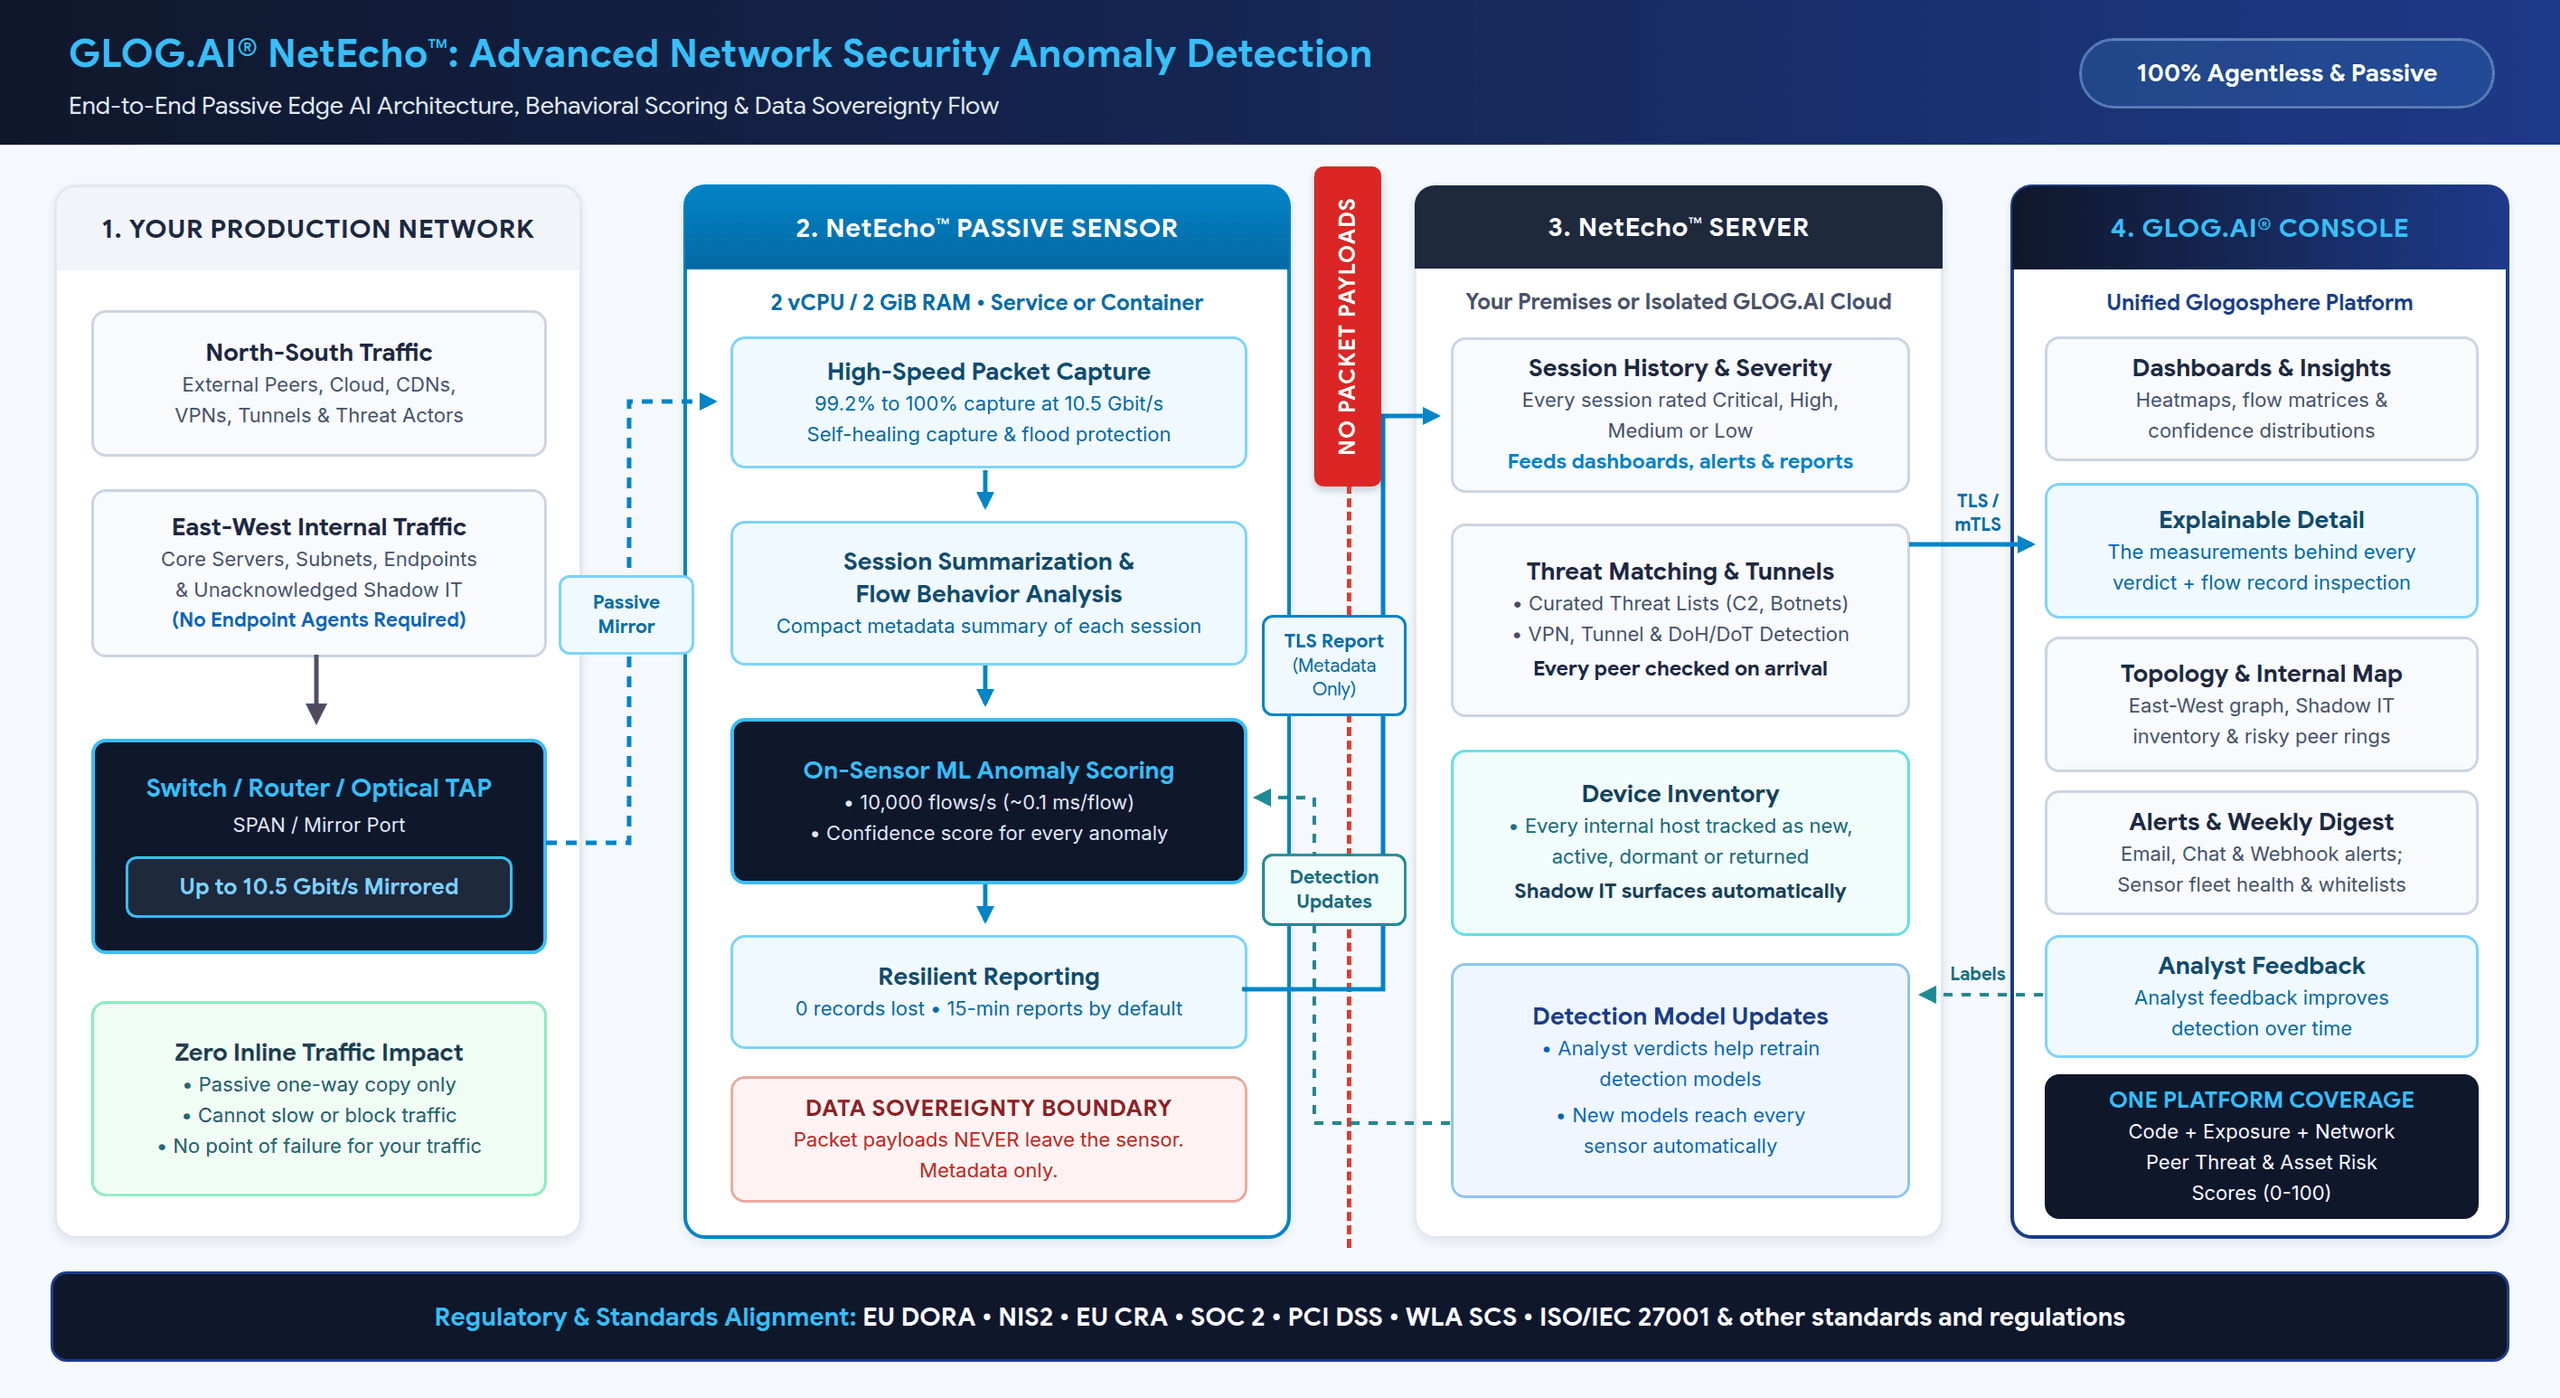


Find the traffic that does not belong on your network, using a passive sensor that never sits in the traffic path and sends zero packet contents off your site.
Most security teams have strong visibility into their external attack surface and their own application code. What moves across the internal network is far harder to see: which internal hosts are talking to unfamiliar external peers, which unacknowledged devices quietly joined a subnet last week, which connections reach known command-and-control (C2) infrastructure, or which endpoints are routing traffic through unauthorized VPNs, tunnels, or encrypted DNS. AI network anomaly detection answers these questions from the traffic itself.
Answering them has typically required deep packet inspection (DPI) appliances. These often demand expensive proprietary hardware, can introduce inline points of failure, and raise serious data-sovereignty questions about where captured network traffic ends up.
GLOG.AI® NetEcho™ changes that equation. Built as part of the unified GLOG.AI Glogosphere platform, NetEcho is an Advanced Network Security Anomaly Detection solution engineered for telecommunications operators, financial institutions, critical infrastructure providers, technology companies, and all enterprises that need deep east-west and north-south visibility, without touching production traffic, deploying endpoint agents, or exporting sensitive packet payloads.
The Paradigm Shift: Zero-Signature Behavioral AI at the Network Edge
Evolved from GLOG.AI’s foundational research in INPRESEC (Intelligent Predictive Security), NetEcho moves network defense beyond static firewall rules and reactive signature matching alone, which remain blind to novel attacks, encrypted C2 channels, and subtle lateral movement. NetEcho scores behavior first and adds threat-intelligence context on top.
Instead of inspecting packet payloads or relying on endpoint agents, a lightweight NetEcho sensor passively watches a mirrored copy of traffic from a switch SPAN port or optical network TAP. Because it reads traffic where it crosses your switches, NetEcho covers wired and wireless clients alike: laptops, phones and IoT devices on Wi-Fi appear as soon as their traffic reaches a mirrored switch or wireless-controller port.
How NetEcho Elevates Network Defense
- Network Flow On-Sensor ML Scoring (~0.1 ms per Flow): NetEcho summarizes network traffic into sessions and evaluates how each session behaves over time, not what it carries, scoring each flow locally in approximately 0.1 milliseconds. Every flagged anomaly receives a confidence score and a severity rating (Critical, High, Medium, or Low), while recurring connections are tracked as repeat instances so beaconing and persistent probing stand out immediately.
- Explainable AI (XAI) with Security-Analyst-in-the-Loop Learning (SAIL): NetEcho eliminates “black-box” AI alerts. For every anomaly, analysts see the exact confidence score, the raw flow record, and the labeled network-flow measurements behind the verdict. Administrators can label detections as true or false positives directly in the console, so detection keeps adapting to your environment.
- Multi-Source Peer Threat Scoring (0–100): External peers are automatically checked against curated threat intelligence feeds (covering C2 servers, criminal netblocks, known attackers, anonymizers, and bogons) and labeled by network type (cloud, CDN, hosting, VPN, or encrypted DNS resolver), ownership, and country. NetEcho combines what threat intelligence says about a peer with how that peer actually behaves on your network into a single Peer Threat Score (0–100).
- Shadow IT, VPN & Tunnel Discovery: NetEcho builds a live inventory of internal hosts (new, active, dormant, or returned) to flag unacknowledged shadow IT, while identifying client and server endpoints running unauthorized VPNs, tunnels, remote shells, or encrypted DNS (DoT/DoH) that bypass local resolvers.
- Attack-Surface & Asset Risk Correlation (0–100): Because NetEcho shares the GLOG.AI console with Security Predictions and Software Security, it automatically matches network peers against your verified domains, hosts, and external exposure data, and calculates a business-weighted Asset Risk Score (0–100) across code, external exposure, and live network behavior.
How It Works: Sovereign Telemetry by Design
NetEcho is architected to keep your production network untouched and your sensitive data strictly inside your perimeter:
| Architectural Stage | What Happens | Security & Privacy Guarantee |
|---|---|---|
| 1. Passive Sensor (Your Network) | Connects to a switch SPAN/mirror port or optical TAP, scores sessions locally on 2 vCPU / 2 GiB RAM, and exports compact reports every 15 minutes (configurable). | Zero Inline Impact & Zero Payloads: Never sits in the traffic path; no packet contents (PCAPs) ever leave your site; only compact session metadata leaves the sensor. |
| 2. Dedicated NetEcho Server (On-Premises or Isolated Cloud) | Receives encrypted (TLS/mTLS) sensor reports, stores sessions and anomalies, enriches peer and asset context, and distributes updated ML models automatically. | Full Tenant Isolation: Dedicated server and database per customer; internal addresses are never sent to external threat lists or outside lookups. |
| 3. GLOG.AI® Glogosphere Console (Unified SOC Interface) | Delivers interactive dashboards, heatmaps, East-West and external topology maps, explainable drill-downs for every detection, whitelists, deduplicated alerts, and weekly digests. | Role-Based Governance: Shared RBAC and alerting across NetEcho, Security Predictions, and Software Security; supports EU DORA, NIS2, EU CRA, SOC2, PCI DSS, WLA SCS, ISO/IEC 27001 and other standards and regulations. |
Verified Benchmark: 10 Gbit/s Performance & DDoS Resilience
Can a lightweight software sensor running in just 2 vCPU and 2 GiB of RAM keep pace with 10 Gbit/s links and survive volumetric SYN floods without losing telemetry?
In the GLOG.AI test lab, we subjected a single 2 vCPU / 2 GiB RAM NetEcho sensor (deployed as a container) to 10.5 Gbit/s mirrored loads, 20 Gbit/s traffic bursts, SYN floods reaching 650,000 new flows per second, and forced process kills, and in a dedicated suite checked every report the sensor logged against what a NetEcho server running in our lab stored.
Key Benchmark Highlights
- Minimal Resource Footprint: Runs in 2 vCPU / 2 GiB RAM (5 GB disk) and consumes only ~1% CPU when idle.
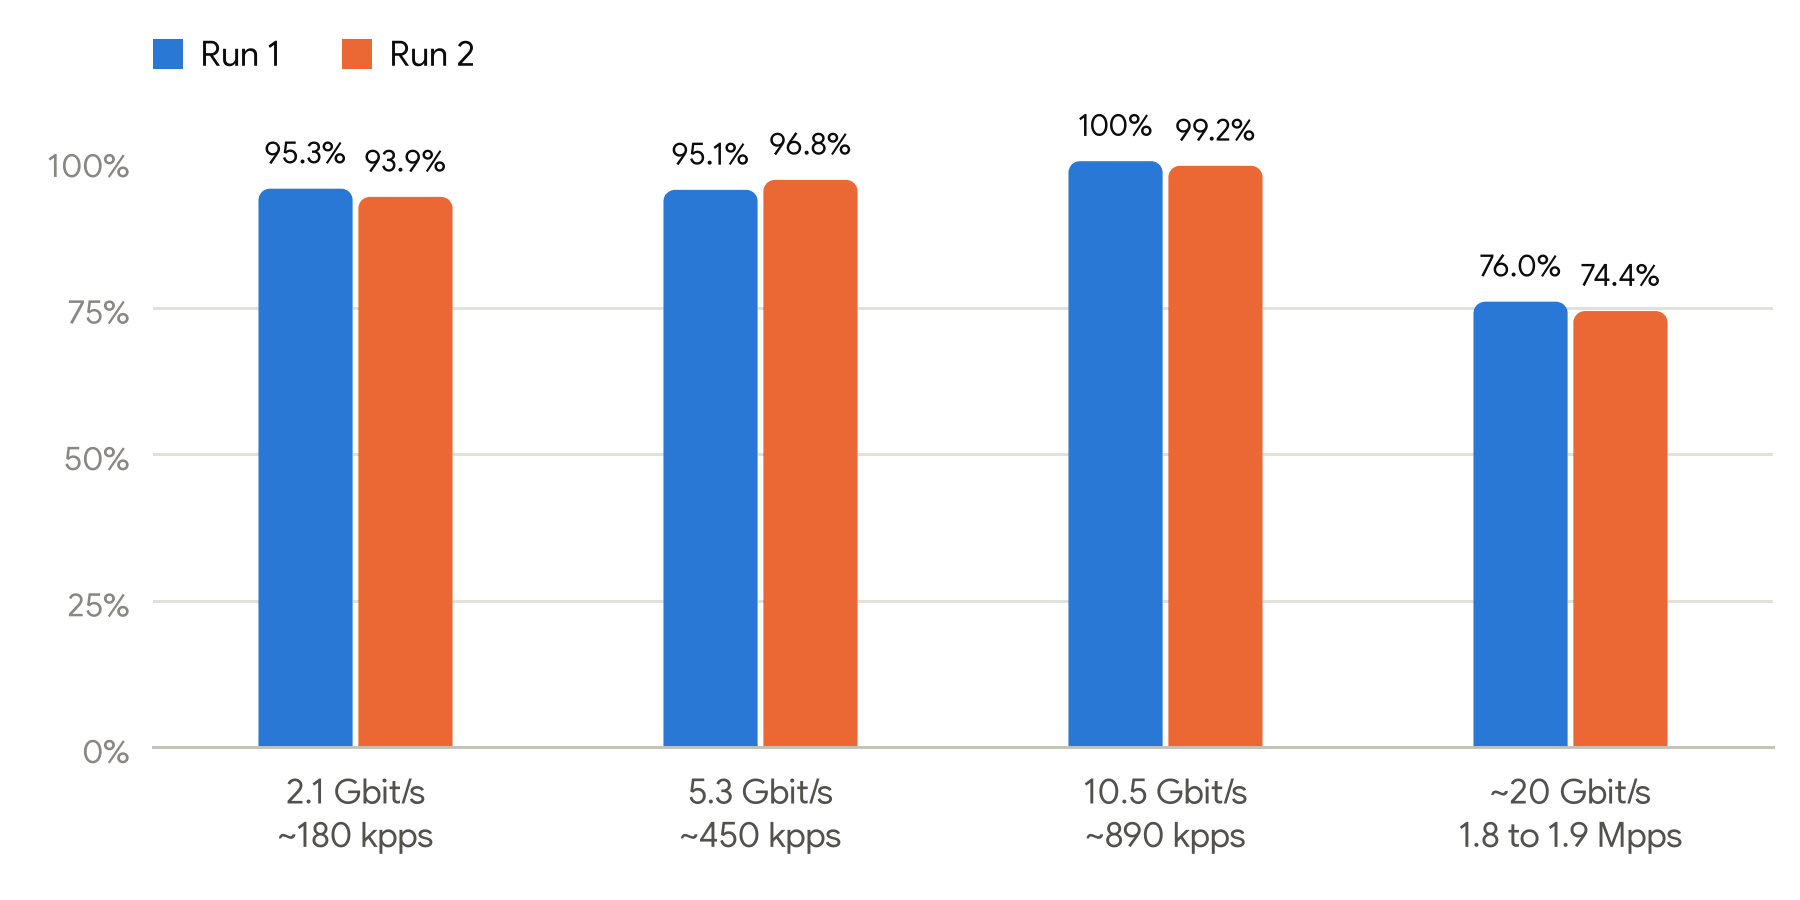
- Line-Rate 10 Gbit/s Packet Capture: Captured 93.9% to 100% of mirrored packets across 2.1 to 10.5 Gbit/s links (99.2% to 100% at 10.5 Gbit/s / 890 kpps using only ~0.6 of a CPU core), and 74.4% to 78.2% during extreme 20 Gbit/s (1.86 Mpps) bursts on a single 2 vCPU sensor.
- High-Velocity ML Scoring: On-sensor machine learning classification kept pace at 10,000 flow records per second (~0.1 ms of CPU per flow). During back-to-back 5,000 and 10,000 flow/s bursts, the sensor buffered and scored all 456,371 records with zero drops.
- 100% Data Integrity Across 3.3 Million Sessions: Through a 2-hour soak, floods and forced process kills, all 376 reports, 3,322,311 sessions, and 1,727,099 anomalies matched the sensor’s logs exactly: 0 records lost and 0 duplicates.
- Survives 650,000 Flow/s SYN Floods & Heals Itself: Strict memory limits protect the host from out-of-memory failures. If the capture process is forcibly terminated, it restarts in 1 to 5 seconds with zero lost records; if capture freezes while traffic keeps arriving, the sensor detects the stall after about 3 minutes and has capture running again 20 seconds later. Capture held at 99% to 100% up to 20,000 new flows/s. At 100,000 new flows/s and above, the sensor stops capture to stay within its memory limit and protect the host, then restarts it automatically within 1 to 3 minutes after the flood subsides.
- Fast Server Ingestion: The NetEcho server stores 5,000 sessions in 0.39 s, 20,000 sessions in 1.26 s, and an extreme 100,000-session report (36.6 MB with 37,734 anomalies) in just 4.4 s (one sensor reporting, measured in our lab).
- Classified in Seconds: On the sensor, a flow is classified 7.5 to 7.8 seconds on average after its packets cross the wire (10.6 seconds at most), and reaches the console with the next report, every 15 minutes by default (configurable).
- Floods Become More Reports, Not Bigger Ones: During a flood the sensor spreads its findings across more reports instead of sending one oversized report, so no single report grows with the flood.
Capture Rate as the Link Fills
Figure 1 shows the share of mirrored packets the sensor captured at each load step, in two separate test runs. Up to 10.5 Gbit/s (about 890,000 packets per second) the sensor captured 93.9% to 100% of the mirrored traffic, using about 0.6 of one CPU core for capture. At about 20 Gbit/s of mirrored traffic it still captured about three quarters of all packets.
Every Report Checked Against the Server
Every test in this suite reported to a NetEcho server running in our lab, and we compared each report the sensor logged with what the server stored: reports, sessions and anomalies. They matched exactly in every test.
| Test | Reports | Sessions | Anomalies | Result |
|---|---|---|---|---|
| 10 Gbit/s load ramp | 16 | 374 | 73 | Exact match |
| SYN flood ramp and soak | 47 | 416,184 | 143,156 | Exact match |
| Classification burst and 4 forced process kills | 17 | 103,291 | 59,779 | Exact match |
| Flood, then frozen capture | 39 | 364,848 | 121,755 | Exact match |
| 2-hour soak | 241 | 2,437,233 | 1,402,263 | Exact match |
| 10 Gbit/s load ramp, repeated | 16 | 381 | 73 | Exact match |
| Total | 376 | 3,322,311 | 1,727,099 | All exact |
In a separate set of runs (the full test suite, the burst tests and two latency runs), all 1,773,269 flow records written were classified and reported, including floods and bursts of 10,000 records per second: none dropped and none unaccounted for.
Two Hours Under Continuous Load
For two hours at 200 Mbit/s in each direction plus 400 new flows per second:
- 241 of 241 reports stored, with 2,437,233 sessions and 1,402,263 anomalies, all matching the sensor’s own logs.
- Sensor memory stayed well inside its 2 GiB budget.
- 0 capture restarts and 0 out-of-memory events.
- From packet to classification: 7.5 seconds on average, 10.6 seconds at most.
How We Tested
The test lab is fully software-defined: forty client and eight server hosts exchange traffic through a router whose uplink is policed to 10 Gbit/s, and every packet crossing the uplink, in both directions, is copied to a monitor interface, as a switch SPAN port would copy it. The NetEcho sensor was limited to 2 vCPU and 2 GiB of RAM and ran with its default settings, apart from a one-minute report interval that let us check results faster. For the end-to-end checks it reported to a NetEcho server running in the lab. Traffic came from iperf3 for bulk TCP (40 clients, up to about 20 Gbit/s on the mirror) and hping3 for SYN floods from random source addresses (up to about 650,000 new flows per second), while a probe sampled the whole chain every 5 seconds.
The whole lab, traffic generators included, ran on one laptop with a 15 W mobile processor, so we treat these figures as a baseline: a pilot on your own SPAN port measures them on your hardware and your traffic.
See NetEcho™ on Your Own Network Traffic
Deploying NetEcho takes minutes: create a sensor in the GLOG.AI console, select the network interface connected to your switch SPAN port or TAP, and launch the ready-to-run system service or container package.
Whether you are strengthening operational resilience for EU DORA, NIS2, EU CRA, SOC2, PCI DSS, WLA SCS, and ISO/IEC 27001, or eliminating blind spots across core enterprise and telecom infrastructure, we can run a non-intrusive pilot on a mirror port in your environment so you can verify capture rates and behavioral detections on your own traffic.
Ready to schedule a live demo or network pilot?
Contact the GLOG.AI team at info@glog.ai.